Wikidata:SPARQL query service/Wikidata Query Help/Перегляд результатів

Ця сторінка допомагає зрозуміти різні можливості відображення результатів SPARQL query service. Сторінка прикладів запитів містить багато хороших прикладів, які можна спробувати!
Після виконання запиту, за допомогою кнопки показу ви можете вибрати, який результат ви хочете відобразити. Залежно від запиту та типу даних, будуть доступні деякі вигляди.
Таблиця (стандарт)
Показує дані результаті у вигляді таблиці. Це вигляд за замовчуванням для результатів і може відображати всі типи даних.
Буде зіставляти кожну змінну з розділу select запиту SPARQL з форматованим стовпцем таблиці.
-
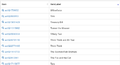 Таблиця результатів
 -
 Таблиця результатів на малих екранах із розвернутими стовпцями


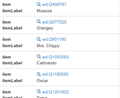
Сітка зображень

Показує результати у вигляді сітки зображень.
Кожен елемент сітки має велике зображення і відкриває галерею при натисканні на нього.
Contents an item is the formatted row data.
| Змінна | Тип | Картографія | Опис |
|---|---|---|---|
| * | Файл Вікісховища | Елемент сітки | Image columns will create a grid item. |
Рядки, які не містять зображення, ігноруватимуться.
It’s nonetheless possible to include no image rows in the result by modifying the sparql by including a default image in case the image variable is not bound:
  optional {
    ?item wdt:P18 ?img_ .
  }
  bind (if(bound(?img_),
           ?img_,
           <http://commons.wikimedia.org/wiki/Special:FilePath/File:Profile_avatar_placeholder_large.png>) as ?image) # [[:commons:File:Profile_avatar_placeholder_large.png]] as a placeholder
Here the file commons:File:Profile avatar placeholder large.png is used as a placeholder, you can use your own
Опції
| Назва опції | Тип | Опис |
|---|---|---|
hide
|
One or more variable names (strings, starting with ?), single value or array
|
Don’t show these variables in the result. |
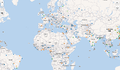
Мапа
Shows the result data as map with OpenStreetMap data.
| Змінна | Тип | Картографія | Опис |
|---|---|---|---|
| * | Координати або географічні контури | Конструктор мапи | Columns will create a marker on the map.
Content of that marker is the formatted row data. |
| ?layer | Map Marker Layer | Creates a colored map layer that allows filtering. | |
| ?rgb | Колір | Color Map Marker | Example 000000 for black color. |
-
 Мапа з шарами Випробувати
 -
 Мапа аеропортів Бельгії Випробувати


Технічно можна відобразити будь-який добре відомий текстовий літерал, а не лише координати точки.
Значення неточкової геометрії ніколи не зберігаються у Вікіданих, але їх можна створити в SPARQL за допомогою таких функцій, як CONCAT() і STRDT() – перегляньте цю карту чеських залізничних ліній з прикладом геометрії LINESTRING().
Опції
specify using e.g. #defaultView:Map{"hide":["?foo", "?bar"],"layer":"?bar"}, using an array when there are multiple variables.
| Назва опції | Тип | Опис |
|---|---|---|
hide
|
One or more variable names (strings, starting with ?), single value or array
|
Don’t show these variables in the result. |
layer
|
One or more variable names (strings, starting with ?), single value or array
|
Use these variables for the map layer, instead of the default ?layerLabel, ?layer.
|
markercluster
|
boolean or object |
|
Line, Bar, Scatter and Area Chart
Shows one of these chart types.
| Змінна | Тип | Картографія | Опис |
|---|---|---|---|
| * | Числа
Мітки DateTime |
Шкала Х
Шкала Y |
First will be X-axis, second Y-axis |
| * | Мітки | Category / Legend Item (optional) | Will only be used after the above are mapped |
| * | Label | Storyboard / Animation (optional) | Will only be used after the above are mapped |


Bubble Chart

Shows a bubble chart where the size and the color of the bubble can configured.
When an item is provided a bubble is linked to Wikidata.org.
| Змінна | Тип | Картографія |
|---|---|---|
| * | Мітки | Bubble Label |
| * | Кількість | Bubble Size |
| * | Елемент | Bubble Link (optional) |
| ?rgb | Колір | Bubble Color (optional) |
Tree Map

Shows a zoomable tree map.
| Змінна | Тип | Картографія | Опис |
|---|---|---|---|
| * | Мітки | Мітки | 1st label in a row will be 1st level in tree map. 2nd label will be 2nd level. 3rd label will be 3rd level etc.. |
| * | Елемент | Посилання (опціонально) | |
| * | Quantity | Size |
Дерево
Показує дерево, яке розгортається.

| Variable | Data Type | Mapping | Опис |
|---|---|---|---|
| * | Елемент | Node ID | First item will be a root node the following items in the same row will be nested. |
| * | Label | Node Label (optional) | Labels will be appended to current node. |
| * | Number | Node Label (optional) | |
| * | Commons Media | Item image |
Часова шкала

Показує часову шкалу, котру можна експортувати
| Змінна | Тип | Картографія | Опис |
|---|---|---|---|
| * | DateTime | Item Point in Time
Item End Point in Time |
First date in a row sets the item position in the timeline.
If a second date is present a start and end date will be set. |
| * | Файл Вікісховища | Зображення |
Опції
| Назва опції | Тип | Опис |
|---|---|---|
hide
|
One or more variable names (strings, starting with ?), single value or array
|
Don’t show these variables in the result. |
Виміри

Shows dimension and their links.
It also allows filtering them by selecting an axis fraction.
This type of graph is also known as parallel coordinates.
| Змінна | Тип | Картографія | Опис |
|---|---|---|---|
| * | Мітки | Вимір | Every column in the result row is mapped to a dimension |
| * | Кількість | ||
| * | DateTime |
Graph
Shows an interactive graph that allow hierarchically ordering and exploring items.
| Змінна | Тип | Картографія | Опис |
|---|---|---|---|
| * | Елемент | Node ID | First item in a row of output variables will have an arrow pointing to the items in the same row. |
| * | Мітки | Мітка Node | |
| * | Файл Вікісховища | Node Image (optional) | |
| ?rgb | Колір | Node Color (optional) | Color of the item just before the rgb variable. Example 000000 for black color. |
| * | Кількість | Node Size (optional) | |
| ?edgeLabel | Label | Edge Label (optional) |

Додаткова інформація
RDF Data Type Mapping
| RDF Type | RDF Data Type | Обмеження | Тип даних |
|---|---|---|---|
| URI | Рядок починається з http://www.wikidata.org/entity/Q |
Entity | |
| URI | Рядок починається з http://commons.wikimedia.org/wiki/Special:FilePath |
Commons Media | |
| Literal | http://www.w3.org/2001/XMLSchema#dateTime | DateTime | |
| Literal | http://www.opengis.net/ont/geosparql#wktLiteral | Coordinate | |
| Literal | http://www.w3.org/2001/XMLSchema#double
http://www.w3.org/2001/XMLSchema#float http://www.w3.org/2001/XMLSchema#decimal http://www.w3.org/2001/XMLSchema#integer http://www.w3.org/2001/XMLSchema#long http://www.w3.org/2001/XMLSchema#int http://www.w3.org/2001/XMLSchema#short http://www.w3.org/2001/XMLSchema#nonNegativeInteger http://www.w3.org/2001/XMLSchema#positiveInteger http://www.w3.org/2001/XMLSchema#unsignedLong http://www.w3.org/2001/XMLSchema#unsignedInt http://www.w3.org/2001/XMLSchema#unsignedShort http://www.w3.org/2001/XMLSchema#nonPositiveInteger http://www.w3.org/2001/XMLSchema#negativeInteger |
Number | |
| Literal | Has no RDF Data Type | Label | |
| Literal | Has property xml:lang |
Label | |
| Literal | String matches /^[0-9A-F]{6}$/ |
Color |
Форматування
Існує спеціальне форматування для таких типів даних:
| Тип даних | Формат |
|---|---|
| Entity | Посилання на Wikidata.org
Назва (мітка) скорочується до wd:Qxx Explore an item (magnify icon) |
| DateTime | MM DD, YYYY
Tooltip shows raw ISO timestamp |
| Commons Media | Посилання на Commons.Wikimedia.org
Displaying Gallery ( image icon ) |
Mobile / Responsive
Result views are made to work on different devices and resolutions. Their appearance may change depending on the space they can use.
Embed Mode
Result views can be linked or embedded via iframes. You can get the regarding link or code by clicking Link in the above menu.
Відмінність: link to a query та link to a result or the embed code:
<iframe style="width:80vw; height:50vh;" scrolling="yes" frameborder="0" src="http://tinyurl.com/zwf4k2w">
Завантаження результатів

Існує декілька способів експорту результатів запиту.
JSON, TSV і CSV — це три різні формати відкритого стандарту для завантаження даних, що пропонуються на вкладці Завантажити. Щоб отримати результати у форматі XML, натисніть Посилання > Точка доступу SPARQL.
You can also download some of the graphic views as a SVG file: this feature works with all the views except table, image grid, timeline, graph builder, map, and graph.
Вигляд за замовчуванням
Вигляд за замовчуванням можна змінити для кожного запиту SPARQL, використовуючи коментар:
#defaultView:[NAME]
Наприклад:
#defaultView:ImageGrid
Параметри подання результатів
Перегляд результатів можна налаштувати за допомогою різних опцій, які вказані у форматі JSON (Q2063),
після коментаря defaultView (див. попередній розділ) або після окремого коментаря view.
#defaultView:Map{"layer": "?typeLabel"}
#view:ImageGrid{"hide": "?coords"}
Title
Result views can show a title. The title can be set via a title comment.
#title:A title of your choice
Auto language
When using the magic keyword [AUTO_LANGUAGE] it is replaced by the users language when submitting the query. This allows writing a query with where the result is displayed in the users language.
Приклад:
#<span lang="en" dir="ltr" class="mw-content-ltr">Use language of the user for display labels and fallback to english as default</span>
SERVICE wikibase:label {
    bd:serviceParam wikibase:language "[AUTO_LANGUAGE],en" .
}
Auto coordinates
When using the magic keyword [AUTO_COORDINATES] it is replaced by the users location when submitting the query. This allows writing a query with the users' location.
Приклад:
  SERVICE wikibase:around {
    ?place wdt:P625 ?coordinate_location.
    bd:serviceParam wikibase:center "[AUTO_COORDINATES]".
    bd:serviceParam wikibase:radius "1".
    bd:serviceParam wikibase:distance ?dist.
  }